Online Model Viewer
2018-2021A web app that paints live construction status onto an interactive 3D building model, replacing per-panel database lookups with a single click.
react · three.js · node · javascript
Problem
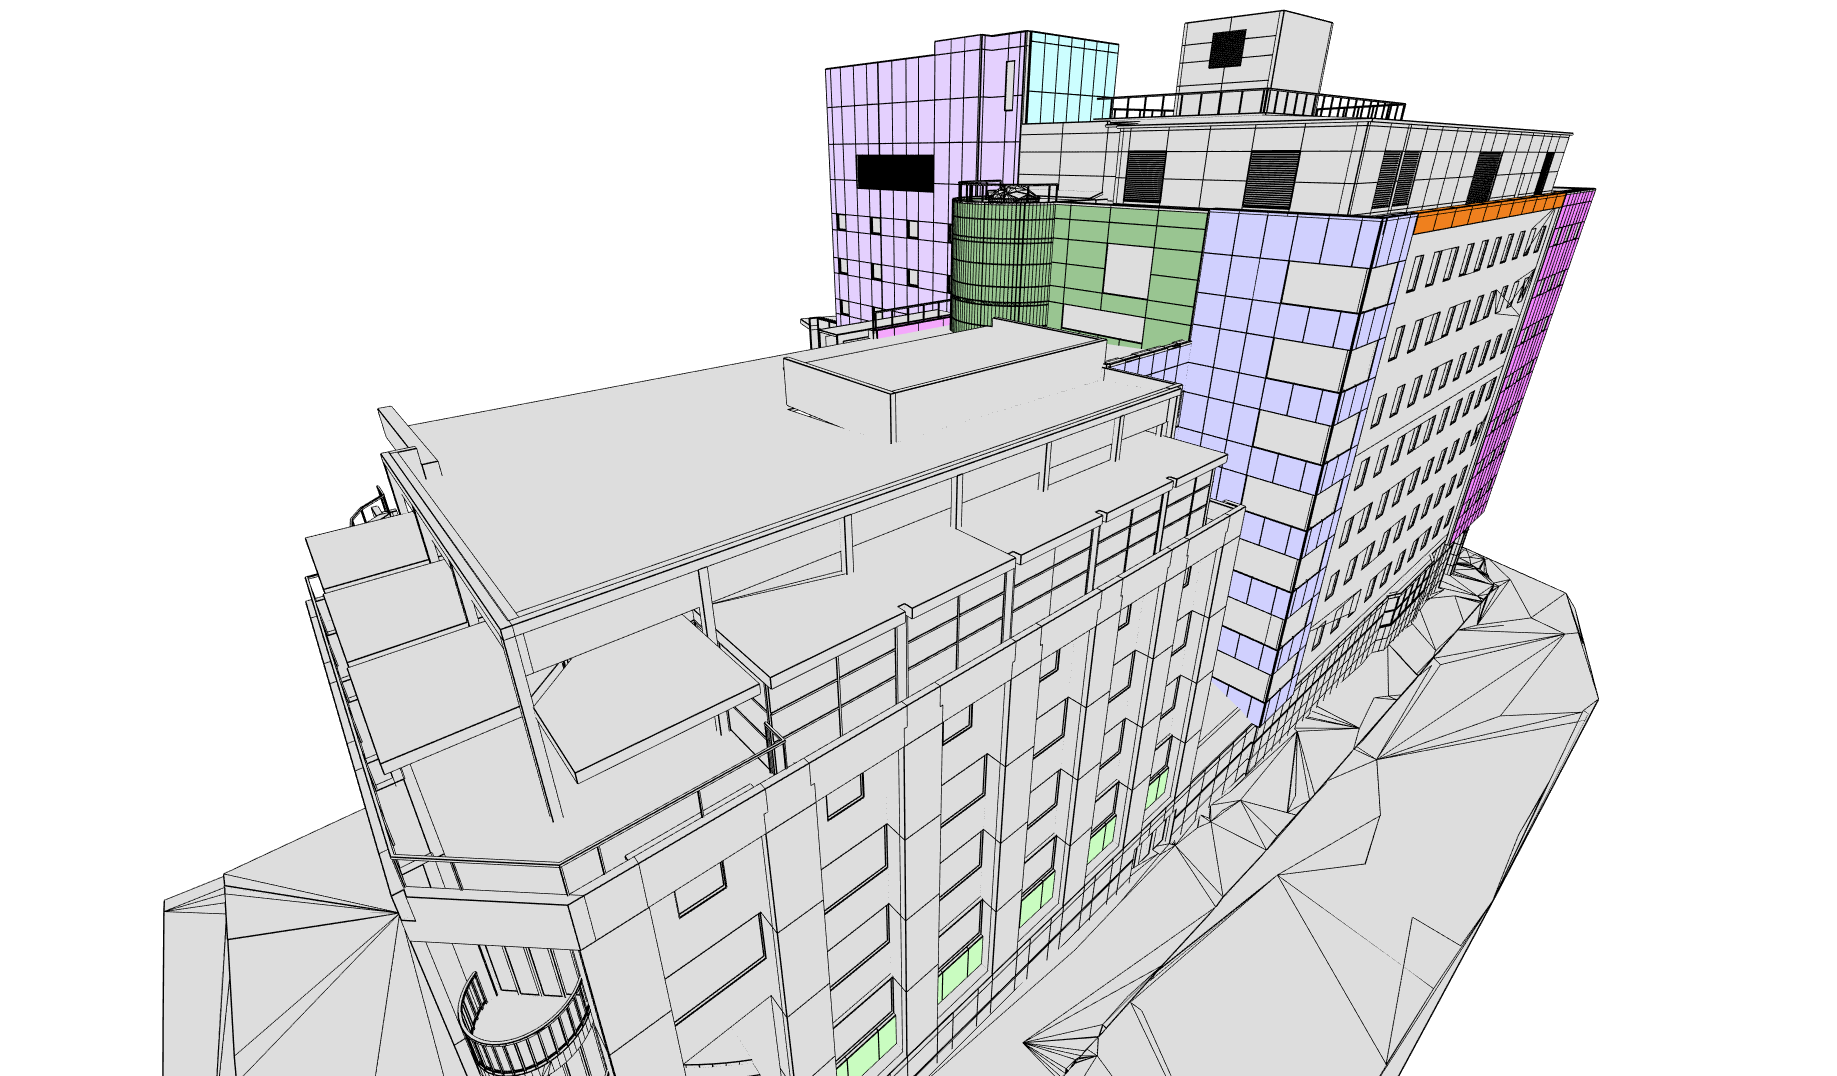
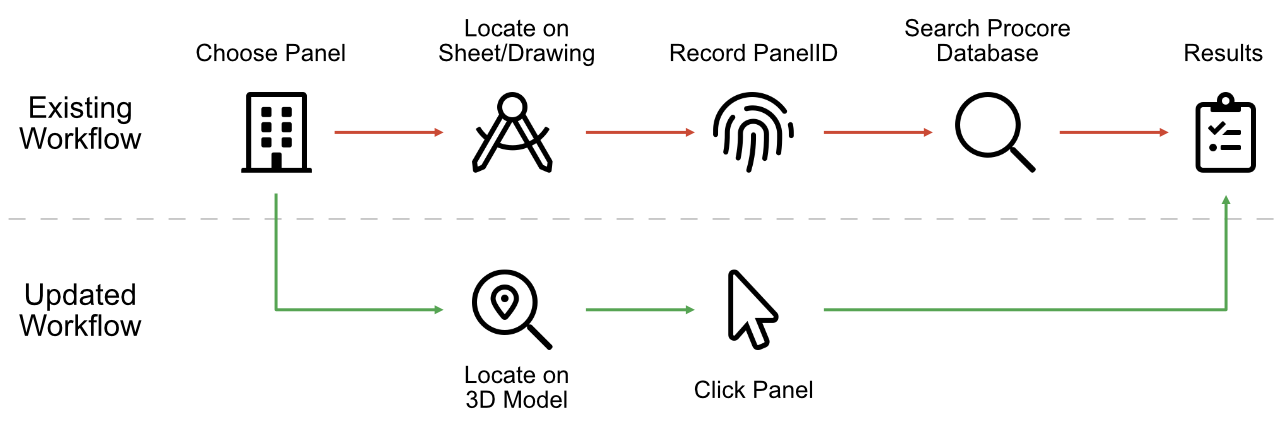
A Sydney high-rise was having its combustible façade panels replaced — thousands of them, each moving independently through inspection, removal, installation, and sign-off. Status for every panel lived in the project management system (Procore), which was accurate but slow to interrogate: to answer “what’s the state of the north face this week?” a site manager had to identify the panel on a drawing, look up its ID, query the database, and read back a row.
The client (SHAPE) wanted that loop collapsed — a way to see progress across the whole building at a glance, drawn straight from the data they were already capturing, without learning to query anything.
Approach
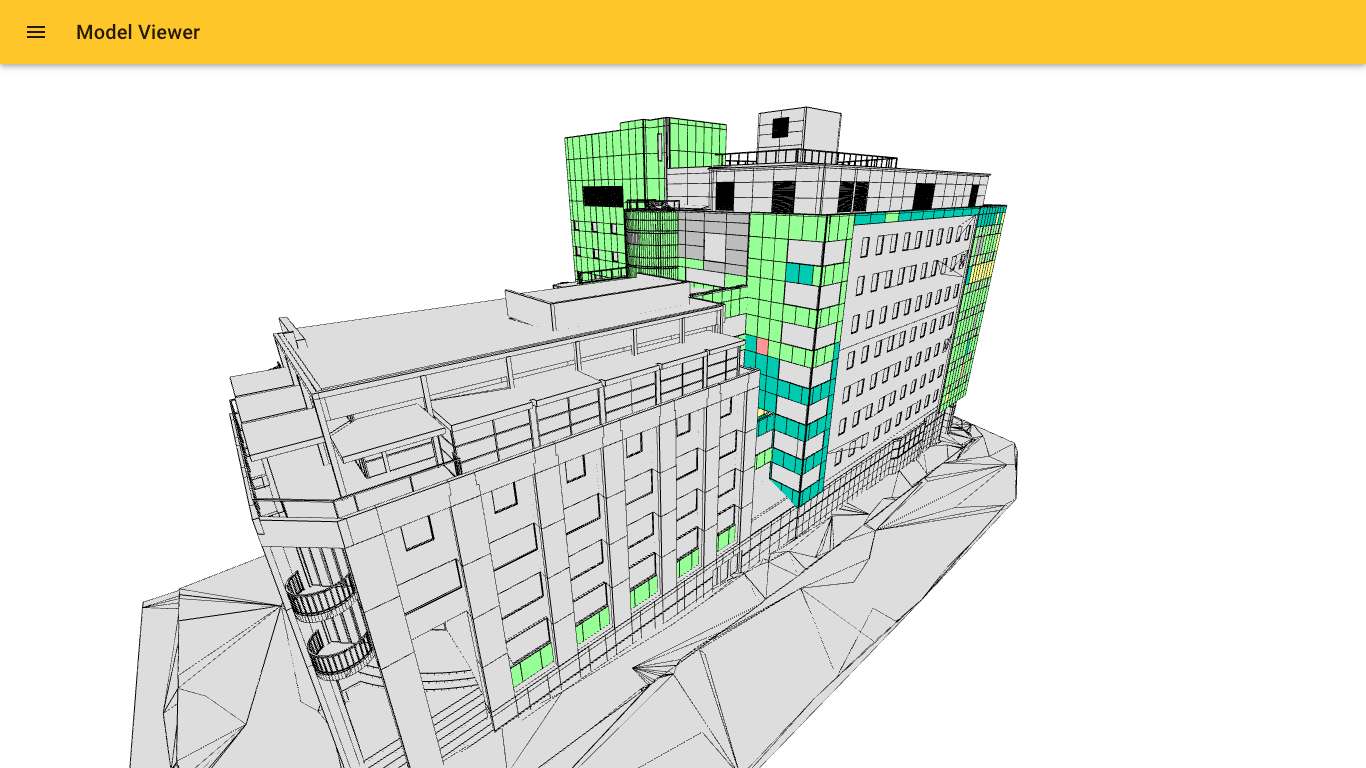
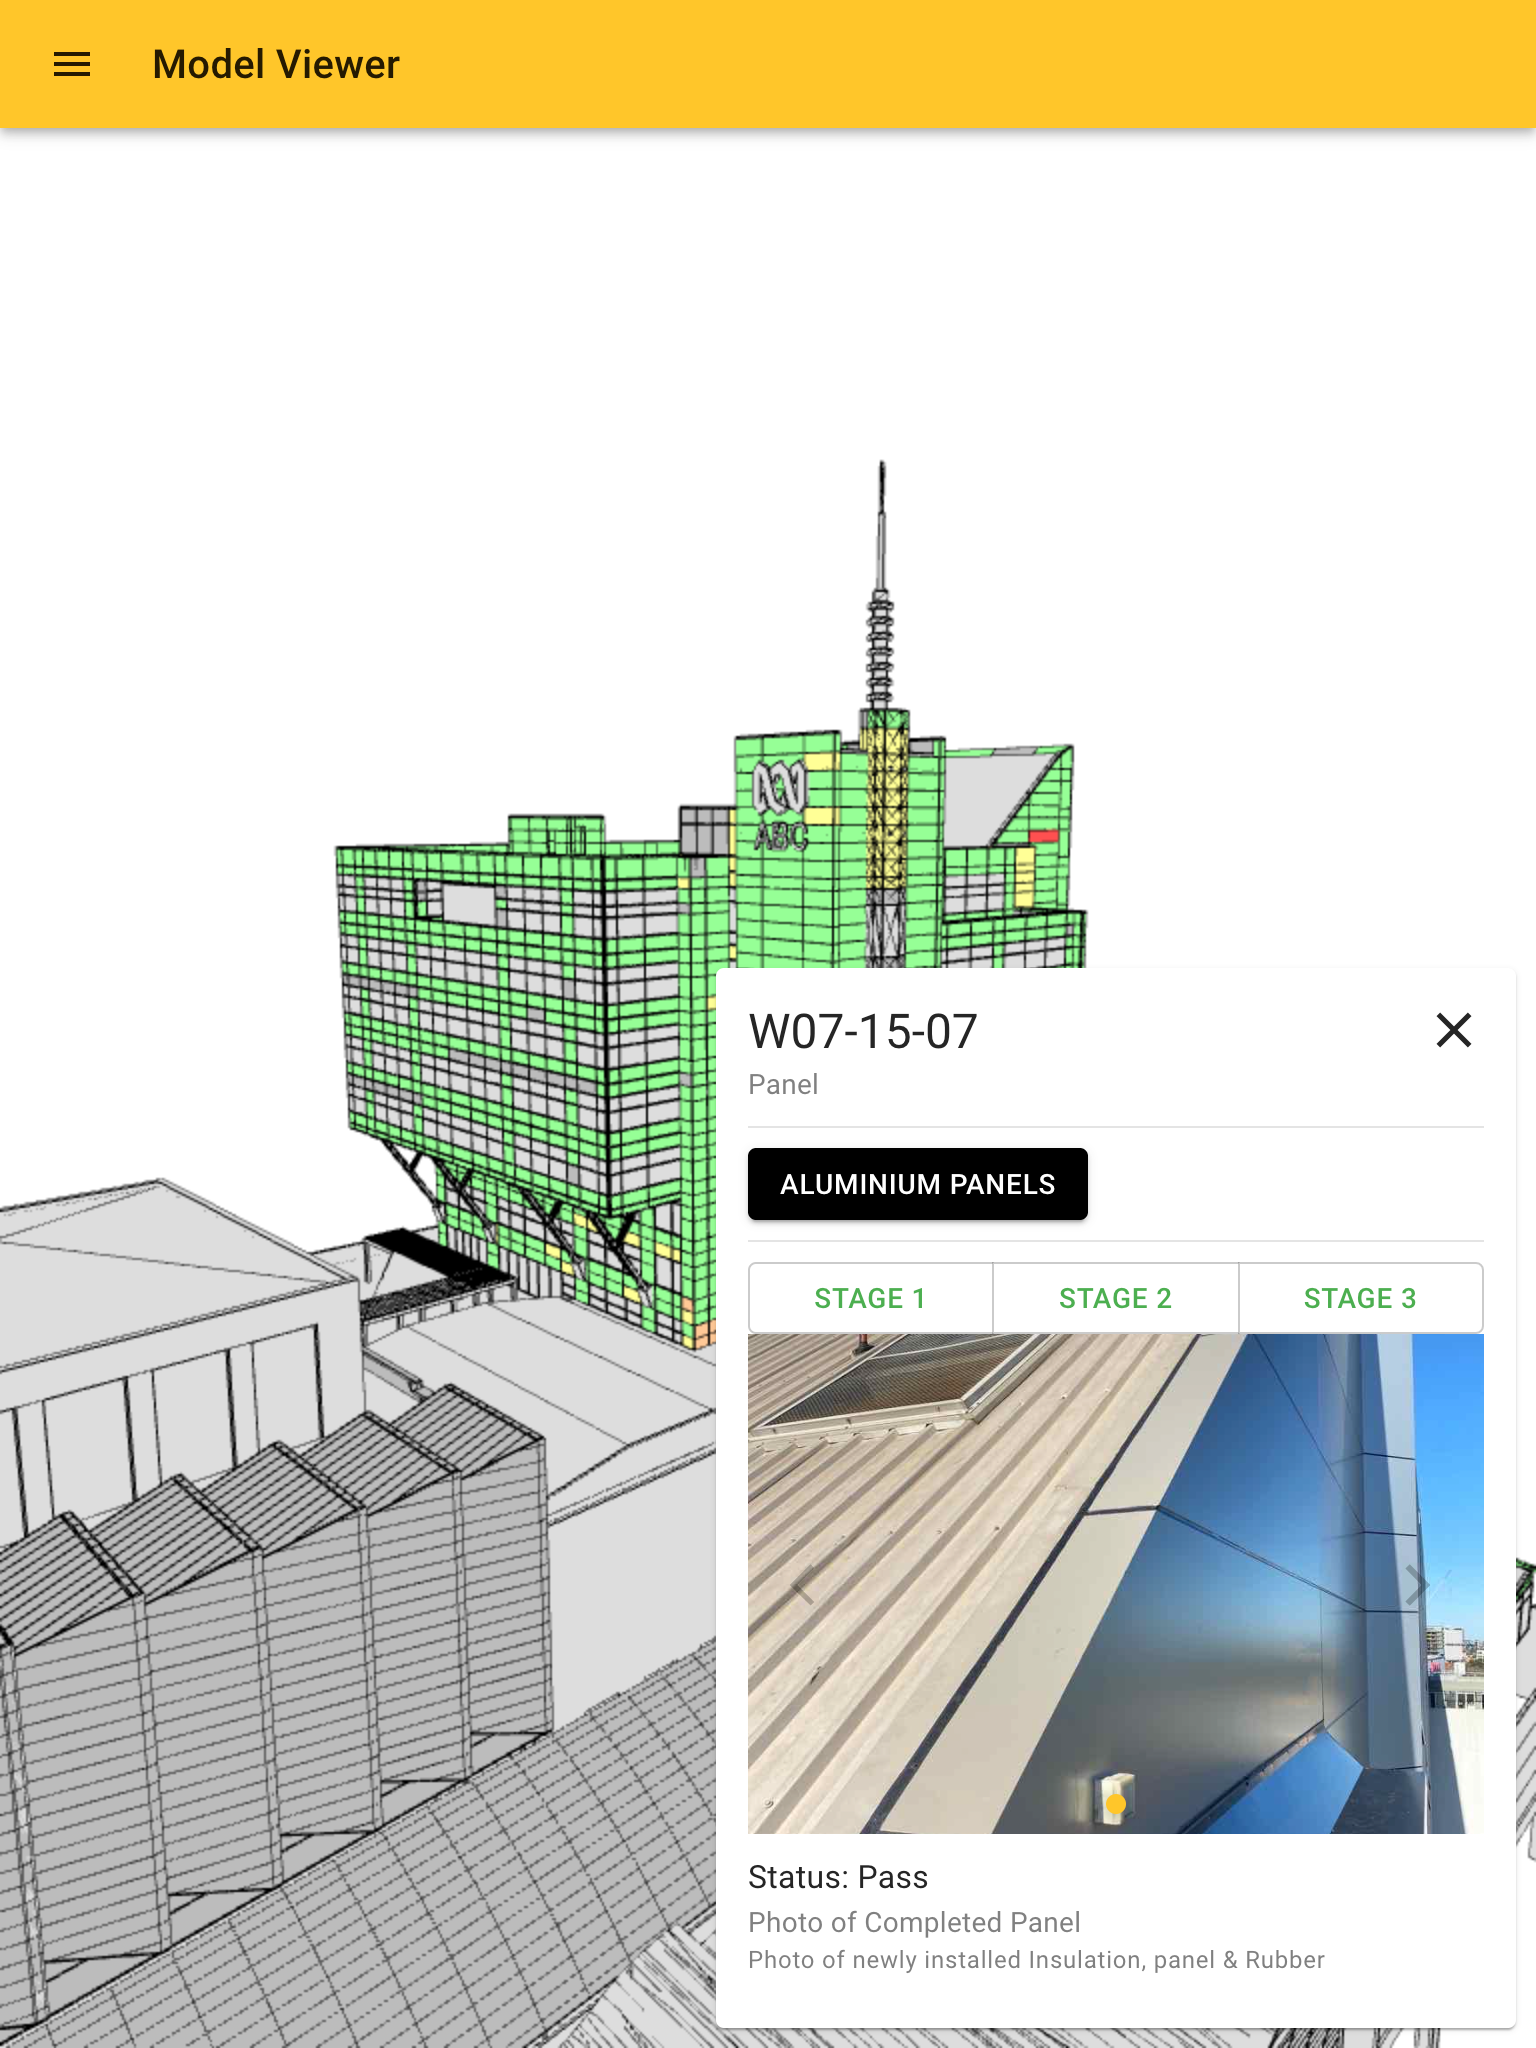
I built a web app that projects the live panel data onto an interactive 3D model of the building. Each panel is colour-coded by status, so the state of an entire elevation reads in one look; clicking a panel pulls its full record on demand.
The front end is React with Three.js for the model; a Node service sits between the browser and the Procore API, normalising responses and caching them so the interface stays responsive. It runs in any browser on desktop or phone — no install, which mattered for site managers working from the scaffold.
Decisions
The model is the interface, not a database query. The whole point was to make the 3D view the primary index into the data. Spatial memory does the lookup work — managers know where a panel is far better than they know its ID — so selecting one in space is faster than any search field.
A Node middleware layer rather than calling Procore directly. The API wasn’t shaped for “give me every panel’s current stage,” and rate limits made per-panel calls from the browser a non-starter. The middleware batches and caches, which is what keeps the click-to-detail interaction instant.
Built to generalise. Panel definitions and status mappings are data, not code, so the same viewer could be pointed at another project’s model and feed.
Outcome
The viewer went into daily use by the client and site managers, and became the default way to check progress on the project. On the strength of it, JHA’s BIM team was engaged to roll the same approach out across further projects — it shifted how the team was positioned commercially, not just how one site reported status.
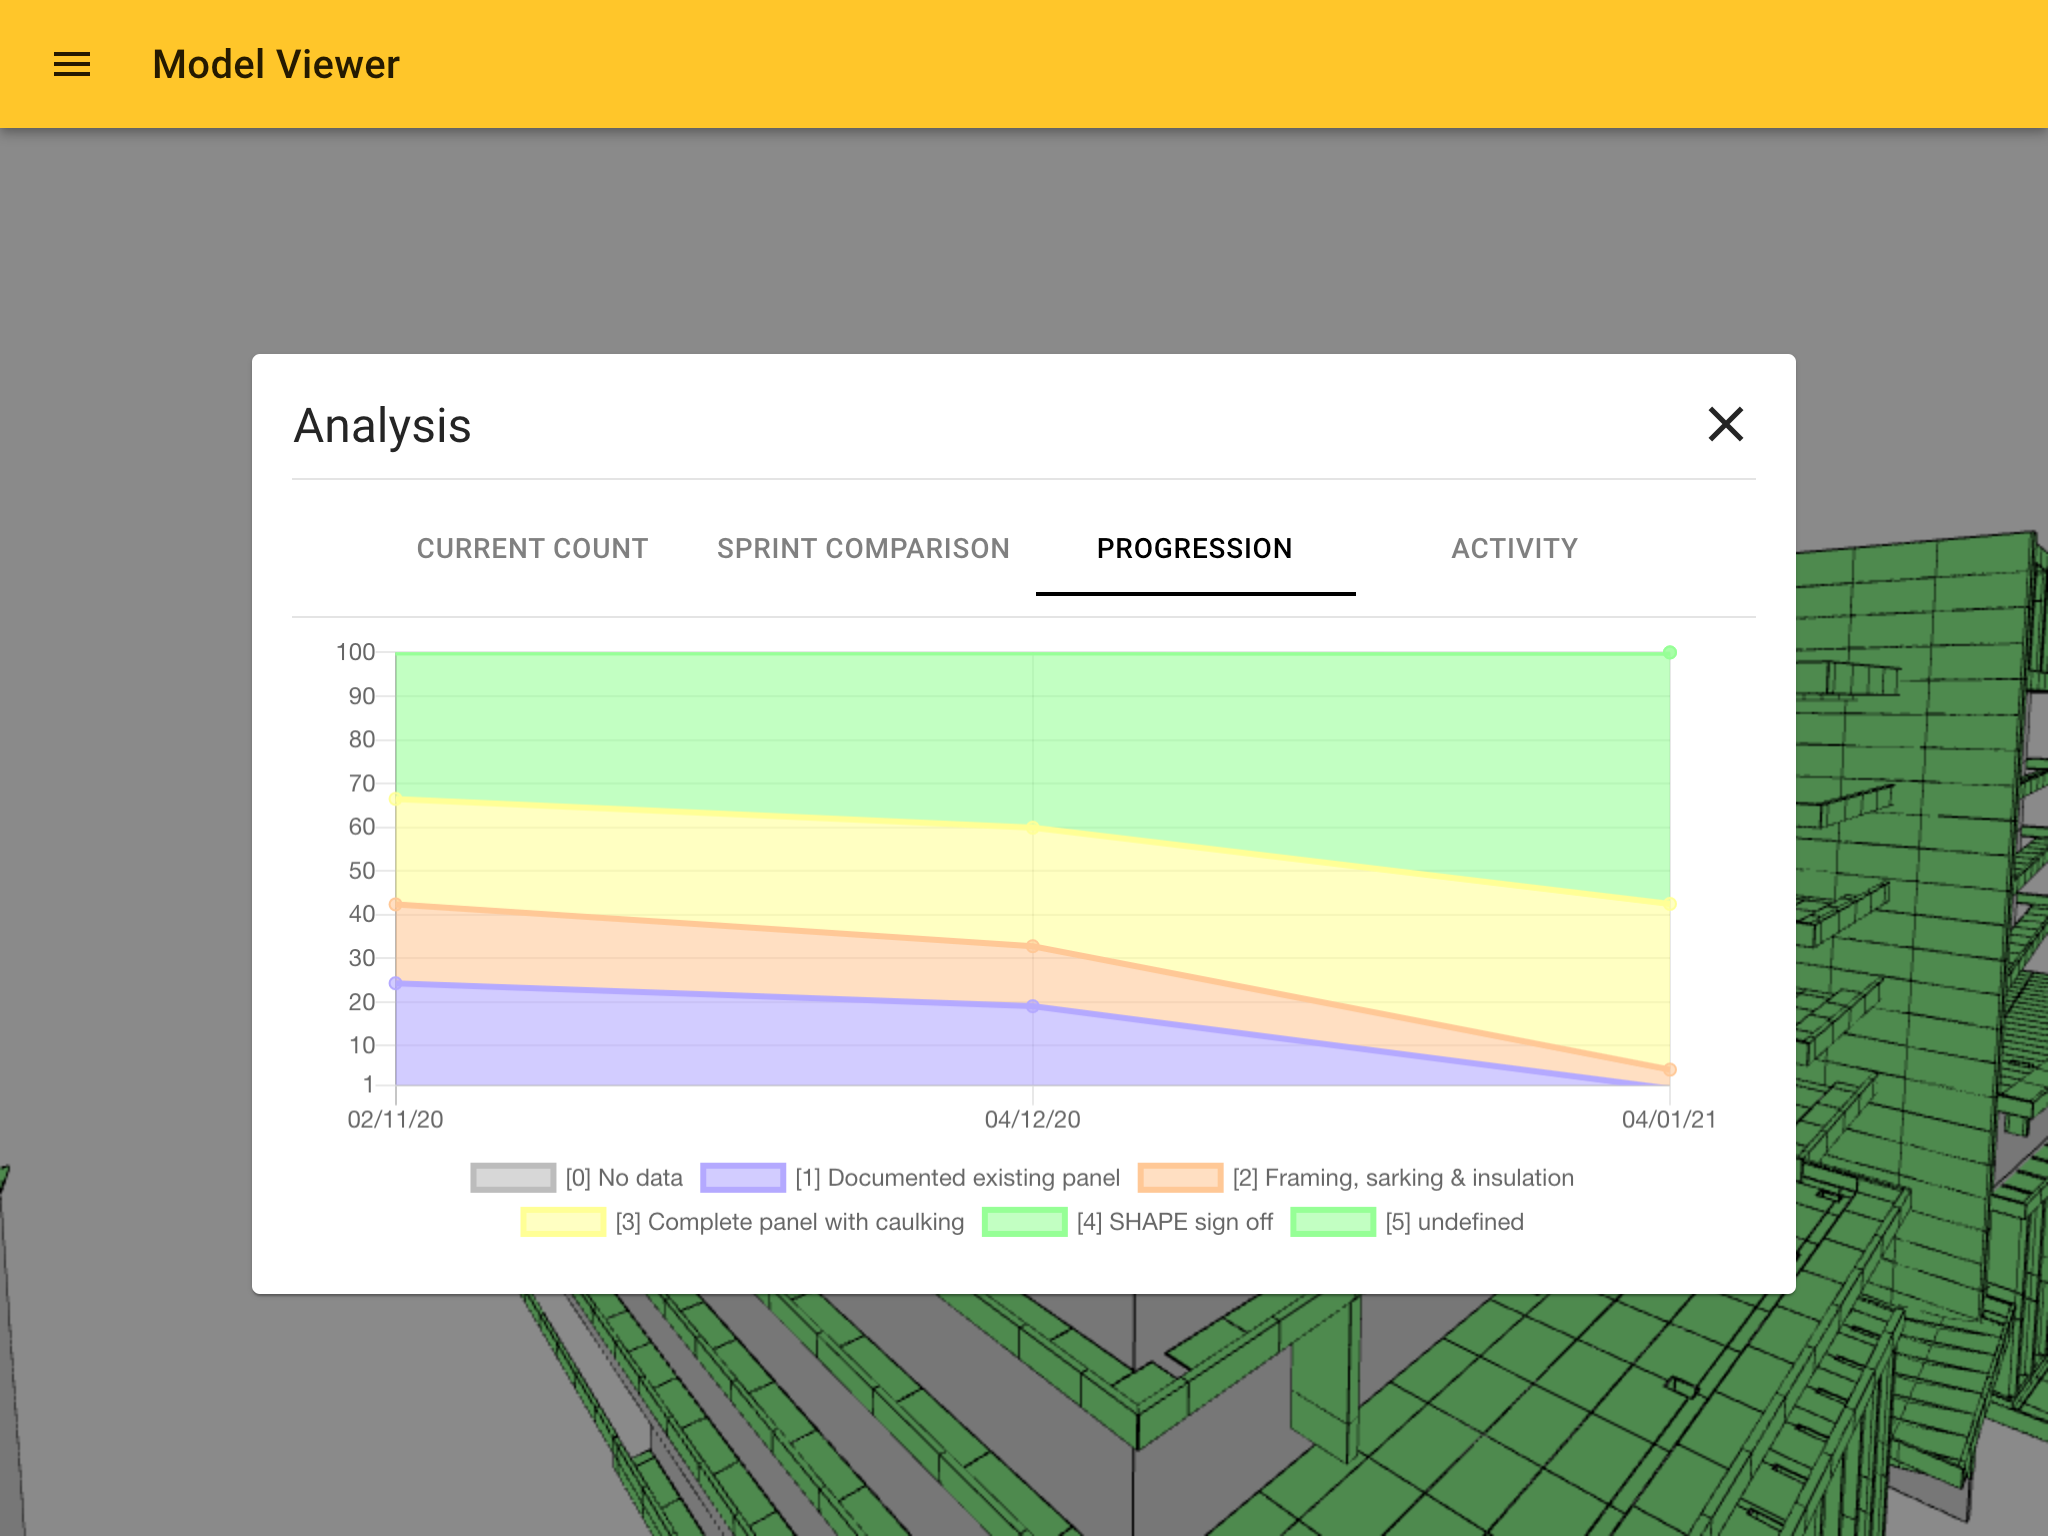
Being able to track progress in real time gives site managers far greater control, and makes it obvious at a glance whether every trade is doing its part. — SHAPE
What I’d revisit: the caching layer was tuned to one project’s update cadence, and generalising it properly — rather than per-deployment tuning — would have made the multi-project rollout cheaper.
References
Built at JHA Services for SHAPE. No public URL — the app is proprietary.